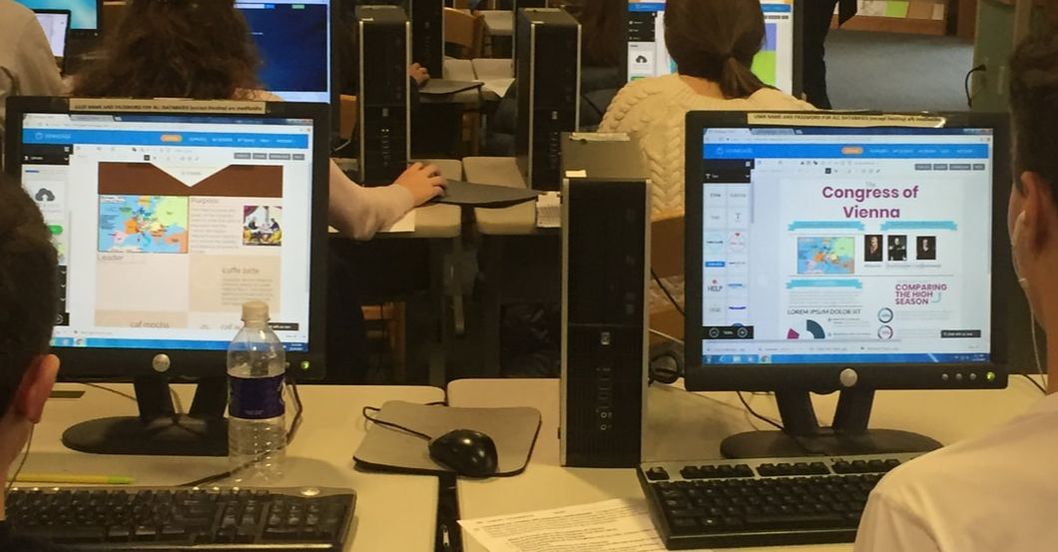
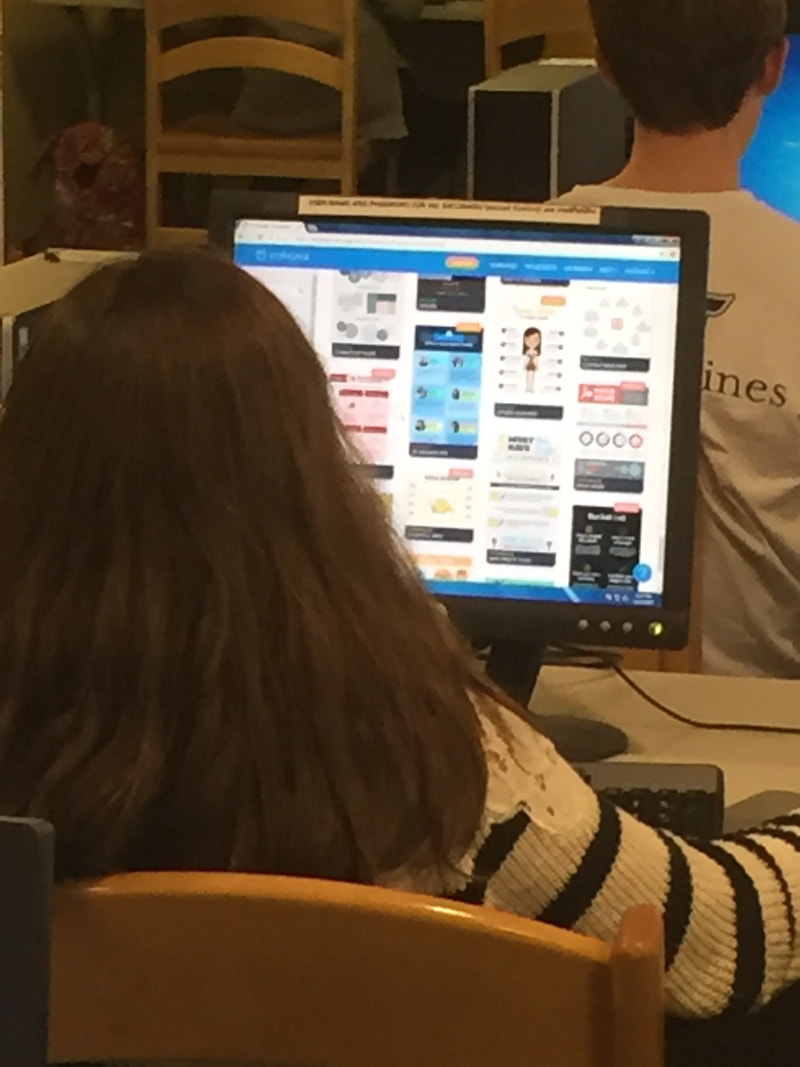
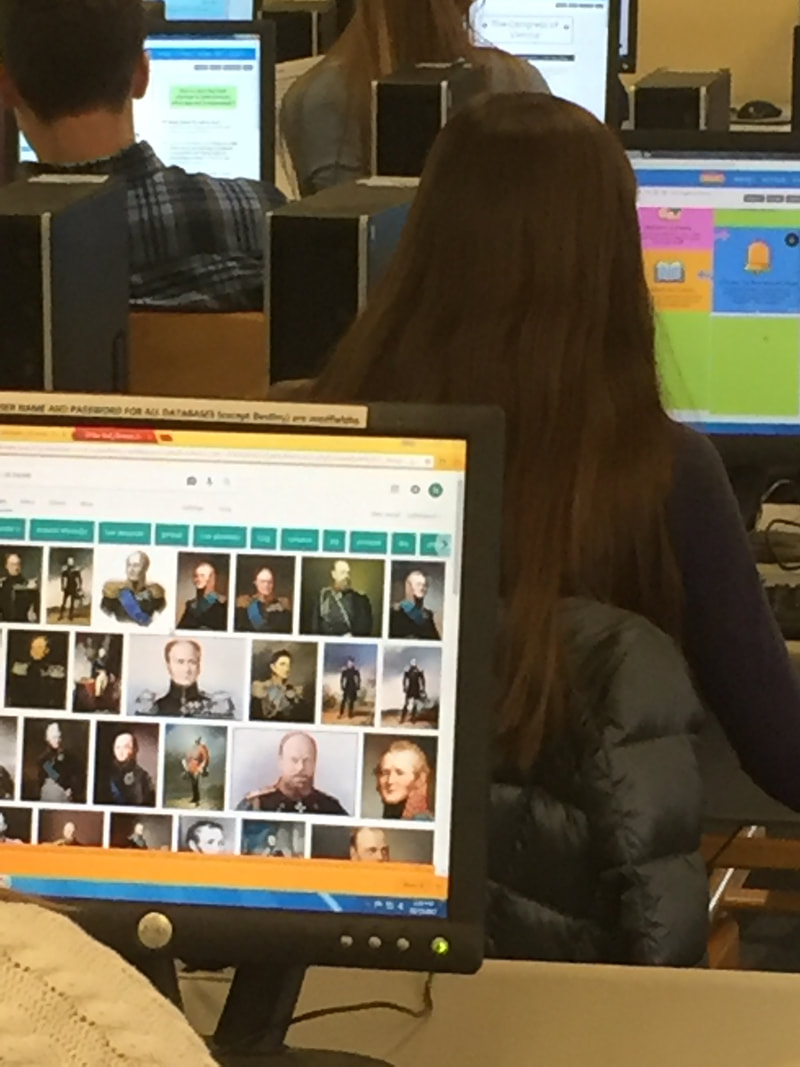
I recently emailed information about two free infographic sites to the faculty. They are called venngage and piktochart. Students create visual images such as a chart or diagram to represent information or data. They are great for group projects or just a different way to present research. Mrs. Buckingham recently used infographics for a couple of her classes doing research on Napoleon and the Congress of Vienna. I was pleased to see the students using their creativity and research skills while working on their infographics in the library.
 |  |